 Facebook
 X
X Telegram
Quarterly report 2025-Q3
added 05-16-2026
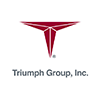
Triumph Group Market Cap 2011-2026 | TGI
As of June 10, 2026 Triumph Group has a market cap of $ 2.01 B
Capitalization is the market value of a company whose shares are traded on the stock exchange. It is calculated by multiplying the market price of a share by the total number of the company's shares. Capitalization indicates volatility, risk, and growth potential. This metric is often used for a quick assessment of a company’s investment profile.[1]
Capitalization is an important indicator for investors and analysts, as it helps determine the size and significance of a company in the stock market. Companies with large capitalization are considered more stable and reliable, as they have more resources and financial power to grow and survive in the market.
This metric can be divided into several categories: small (from 300 million to 2 billion dollars), medium (from 2 to 10 billion dollars), and large (over 10 billion dollars). Companies with different levels of capitalization have their own characteristics and risks, so investors usually take this indicator into account when making investment decisions.
Capitalization can also change over time depending on the share price and the number of shares in circulation. Therefore, it is a dynamic indicator that requires constant monitoring and analysis to make well-informed investment decisions.
Annual Market Cap Triumph Group
| 2025 | 2024 | 2023 | 2022 | 2021 | 2020 | 2019 | 2018 | 2017 | 2016 | 2015 | 2014 | 2013 | 2012 | 2011 | 2010 | 2009 | 2008 |
|---|---|---|---|---|---|---|---|---|---|---|---|---|---|---|---|---|---|
| 1.99 B | 1.05 B | 917 M | 911 M | 949 M | 355 M | 1.18 B | 1.17 B | 1.29 B | 1.78 B | 3.01 B | 3.35 B | 3.97 B | 3.07 B | 1.94 B | - | - | - |
All numbers in USD currency
Indicator range from annual reports
| Maximum | Minimum | Average |
|---|---|---|
| 3.97 B | 355 M | 1.79 B |
References
- Pavone, P. (2019). Market capitalization and financial variables: Evidence from Italian listed companies. International Journal of Academic Research Business and Social Sciences, 9(3), 1356-1371.
Market Cap of other stocks in the Aerospace industry
| Issuer | Market Cap | Price | % 24h | Market Cap | Country | |
|---|---|---|---|---|---|---|
|
Embraer S.A.
ERJ
|
30.6 B | - | - | $ 11 B | ||
|
НПО Наука
NAUK
|
2.34 B | - | - | - | ||
|
Intevac
IVAC
|
108 K | - | - | $ 107 K | ||
|
CPI Aerostructures, Inc.
CVU
|
46.6 M | $ 4.97 | -0.2 % | $ 59.1 M | ||
|
Aerojet Rocketdyne Holdings
AJRD
|
4.51 B | - | 1.42 % | $ 4.62 B | ||
|
Корпорация ИРКУТ
IRKT
|
38.3 B | - | - | - | ||
|
РКК Энергия
RKKE
|
7.63 B | - | - | - | ||
|
Объединенная авиастроительная корпорация
UNAC
|
190 B | - | - | - | ||
|
EHang Holdings Limited
EH
|
2.33 M | $ 6.68 | -23.31 % | $ 980 K | ||
|
Ducommun Incorporated
DCO
|
1.82 B | $ 156.28 | 4.16 % | $ 2.34 B | ||
|
HEICO Corporation
HEI
|
41.8 B | $ 326.42 | 0.9 % | $ 45.4 B | ||
|
Innovative Solutions and Support
ISSC
|
197 M | $ 18.02 | 3.5 % | $ 317 M | ||
|
Hexcel Corporation
HXL
|
6.97 B | $ 93.06 | 4.34 % | $ 7.4 B | ||
|
Cubic Corporation
CUB
|
1.85 B | - | 0.32 % | $ 2.38 B | ||
|
Kratos Defense & Security Solutions
KTOS
|
15.4 B | $ 56.19 | -2.67 % | $ 9.14 B | ||
|
RADA Electronic Industries Ltd.
RADA
|
632 M | - | -0.4 % | $ 491 M | ||
|
Northrop Grumman Corporation
NOC
|
97.5 B | $ 548.67 | 1.45 % | $ 78.7 B | ||
|
Raytheon Technologies Corporation
RTX
|
267 B | $ 181.56 | 1.65 % | $ 244 B | ||
|
Astrotech Corporation
ASTC
|
8.32 M | $ 25.58 | -12.19 % | $ 42.6 M | ||
|
Smith & Wesson Brands
SWBI
|
388 K | $ 14.85 | 1.23 % | $ 661 K | ||
|
TAT Technologies Ltd.
TATT
|
519 M | $ 43.33 | -0.76 % | $ 523 M | ||
|
Kaman Corporation
KAMN
|
1.29 B | - | - | $ 1.3 B | ||
|
Lockheed Martin Corporation
LMT
|
146 B | $ 530.13 | 1.93 % | $ 123 B | ||
|
L3Harris Technologies
LHX
|
63.6 B | $ 308.17 | 2.01 % | $ 57.8 B | ||
|
Mercury Systems
MRCY
|
3.15 B | $ 108.82 | -1.91 % | $ 6.39 B | ||
|
VSE Corporation
VSEC
|
4.75 B | $ 178.62 | 4.08 % | $ 3.78 B | ||
|
VirTra
VTSI
|
49.9 M | $ 3.32 | -0.9 % | $ 37.4 M | ||
|
B.O.S. Better Online Solutions Ltd.
BOSC
|
28 M | $ 4.31 | 1.89 % | $ 26.6 M | ||
|
CAE
CAE
|
8.96 B | $ 25.58 | 1.91 % | $ 8.16 B | ||
|
Astronics Corporation
ATRO
|
2.82 B | $ 84.59 | 0.32 % | $ 3 B | ||
|
Woodward
WWD
|
17.6 B | $ 380.59 | 5.78 % | $ 22.7 B | ||
|
AAR Corp.
AIR
|
3.72 B | $ 120.13 | 4.72 % | $ 4.28 B | ||
|
The Boeing Company
BA
|
178 B | $ 214.51 | -0.65 % | $ 163 B | ||
|
Sturm, Ruger & Company
RGR
|
609 M | $ 38.88 | 1.09 % | $ 631 M | ||
|
Air Industries Group
AIRI
|
13.1 M | $ 3.01 | -0.5 % | $ 12.7 M | ||
|
AgEagle Aerial Systems
UAVS
|
22.5 M | $ 0.92 | -4.03 % | $ 23 M | ||
|
SIFCO Industries
SIF
|
20.3 M | $ 20.07 | -2.9 % | $ 122 M | ||
|
Virgin Galactic Holdings
SPCE
|
111 M | $ 4.59 | 11.41 % | $ 235 M | ||
|
General Dynamics Corporation
GD
|
94.2 B | $ 345.68 | 1.41 % | $ 93 B | ||
|
Textron
TXT
|
17.3 B | $ 93.29 | 2.03 % | $ 16.7 B | ||
|
Park Aerospace Corp.
PKE
|
636 M | $ 34.4 | 7.84 % | $ 687 M | ||
|
Spirit AeroSystems Holdings
SPR
|
4.07 B | - | - | $ 4.61 B | ||
|
TransDigm Group Incorporated
TDG
|
75.8 B | $ 1 257.24 | 4.22 % | $ 73.2 B | ||
|
BWX Technologies
BWXT
|
18.3 B | $ 188.96 | 0.8 % | $ 17.3 B | ||
|
Vectrus
VEC
|
999 M | - | -0.94 % | $ 375 M | ||
|
Coda Octopus Group
CODA
|
120 M | $ 11.36 | -3.07 % | $ 128 M | ||
|
AeroVironment
AVAV
|
4.88 B | $ 176.51 | -4.42 % | $ 4.95 B | ||
|
Elbit Systems Ltd.
ESLT
|
39.8 B | $ 837.59 | 0.9 % | $ 38.3 B | ||
|
Frontline Ltd.
FRO
|
4.03 B | $ 36.27 | 3.6 % | $ 8.07 B |